In July, ISTAT (the Italian National Institute of Statistics) has published the Report ‘Poverty in Italy’ which provides, every year, a general, updated picture of the Italian situation.
The Report – based on data contained in the Household consumption expenditure Report – explains that the phenomenon of poverty is substantially stable. Compared to 2013, statistics that represent both absolute and relative poverty do not show any significant variation. However, in order to understand the current principal tendencies and the differences that social and territorial issues can entail, a close analysis of the elaborated valuations is needed.
Considering absolute poverty, it is important to precise that such a category includes all families whose monthly expense is equal or inferior to a threshold, corresponding to the minimum required expense for obtaining goods and services that allow an acceptable life standard. The value of such threshold varies in function of the family size, the age composition within the family, the geographical area and the demographic size of the place of residence (on the ISTAT website one can easily calculate the value of this threshold).
According to ISTAT, in 2014, one million and 470 thousand families were living in condition of absolute poverty (or 5.7% of the total), which means that 4 million and 102 thousand people suffer from this condition (6.8% of the total population). While absolute poverty had been growing in the previous two years (2012 and 2013), in 2014 it appears stabilized if compared to 2013. As also shown by previous ISTAT Reports, it is interesting to underline that the territorial distribution of poverty is not homogenous. In fact, 5.7% of the population experience absolute poverty in the North, while in the South numbers reach 8.6%. Considering households’ composition, large families are the most affected ones (16,4% of the families with 5 or more people experience absolute poverty). In the same way, families which are composed of foreigners also suffer such a condition (12,9% of mixed families and 23,4% of foreign families). On the other hand, absolute poverty tends to decrease when people age and their educational qualification increase. Moreover, it appears that while in the North such a phenomenon tends to concentrate more in metropolitan areas, in the South absolute poverty is more elevated in small districts. As ISTAT interestingly highlights, these data prove the existence of two different dimensions within the more general phenomenon of absolute poverty: a rural one connected to the South and an urban one more common in the North.
As observed for absolute poverty, relative poverty too seems to be stable if compared to 2013. In 2014, 10.3% of Italian families were experiencing such a condition (i.e. 2 million and 654 thousand family units), corresponding to 7 million 815 thousand individuals (or 12.9% of the population) while in 2013, 13% of the population was in this precarious situation. Relative poverty is calculated according to an established threshold – ‘the poverty line’ – which corresponds, for a family unit of 2 people, to the average monthly expense per person in Italy. Larger families have an equivalent measurement available which considers economies of scale when the family unit grows. Family units which are under this poverty line are considered as suffering from relative poverty.
Considering different age groups, ‘minors’ is the category where statistics appear to be more dramatic: almost 1 minor out of 5 (the 19%) is in a condition of relative poverty. Considering the geographical distribution of relative poverty, territorial cleavages are confirmed, as for absolute poverty: it appears indeed that families experiencing such a condition are the 4.9% of the total in the North, the 6.3% in the Centre and 21.1% of the in the South. The less affected regions are Trentino-Alto Adige, Lombardy and Emilia-Romagna, where the relative poverty rate is around 4%. On the other hand, the most affected ones are Calabria, Basilicata and Sicily where more than a family out of 4 are impacted. Apart from Abruzzo, the incidence of relative poverty in all southern regions is higher than the national average. Large families tend to suffer the most: at a national level, 28% of these families are in a condition of relative poverty. In the South, these are almost 37%. Finally, households whose head has attained a low level of education find themselves in this situation two times more than those families whose head has at least completed high school (respectively more than 15% vs 6,2%).
Eventually, ISTAT came up with an interesting figure which represents both the standard poverty line and various ‘poverty thresholds’ (corresponding to the 80, 90, 110, and 120% of the standard line), in order to classify families in different groups, and to show how they are distant (in a positive or negative way) from the standard line. This allows overcoming the simple distinction between poor and not-poor households.
Figure 1. Poor and Non Poor Households by Different Poverty Lines (%; year: 2014)
Source: "Poverty in Italy", ISTAT, Rome, 2015 (p. 8)
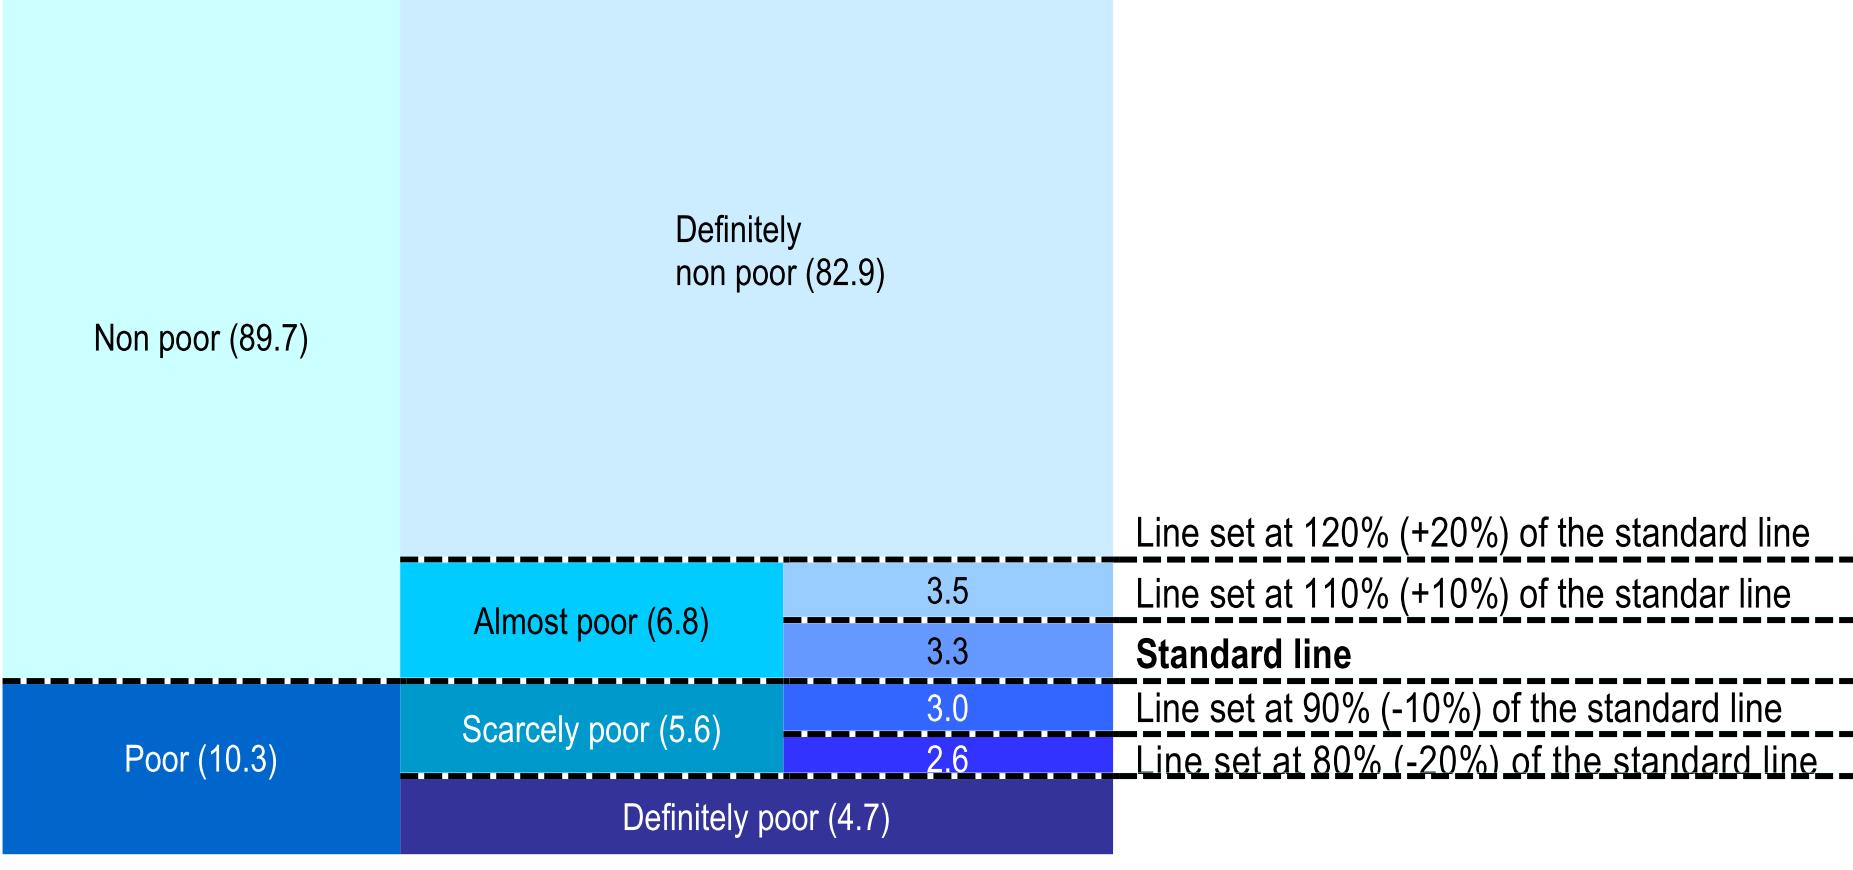
Looking at the ‘negative’ side of the graph, families whose monthly expenses are below the standard line by 20% are defined as "definitely poor". In 2014, they represented the 4.7%. "Scarcely poor" families are those families whose expenses were 10% below the standard line. They represented the 5.6% of the total. On the other hand, the ‘positive’ side of the graph allows identifying not only families which are categorized as "definitely not poor" (82.9% of the total) but also those that are considered "almost poor". The latter are families which, while being above the standard poverty line, are characterized by expenditure levels very close to it: 6.8% of the total families appear to be in such situation.
References
ISTAT – Poverty in Italy 2014 (in English)
ISTAT – La Povertà in Italia 2014 (in Italian – full version)